Application Observability
Leverage best-in-class application performance monitoring (APM) to ensure optimal service performance and SLOs. Innovate faster, resolve issues instantly, and deliver more with less—all with telemetry in context.


Keep applications running at peak performance
Prevent downtime, reduce MTTR, and maintain service quality across any environment.

Gain real-time insights into application behavior to optimize and resolve issues faster
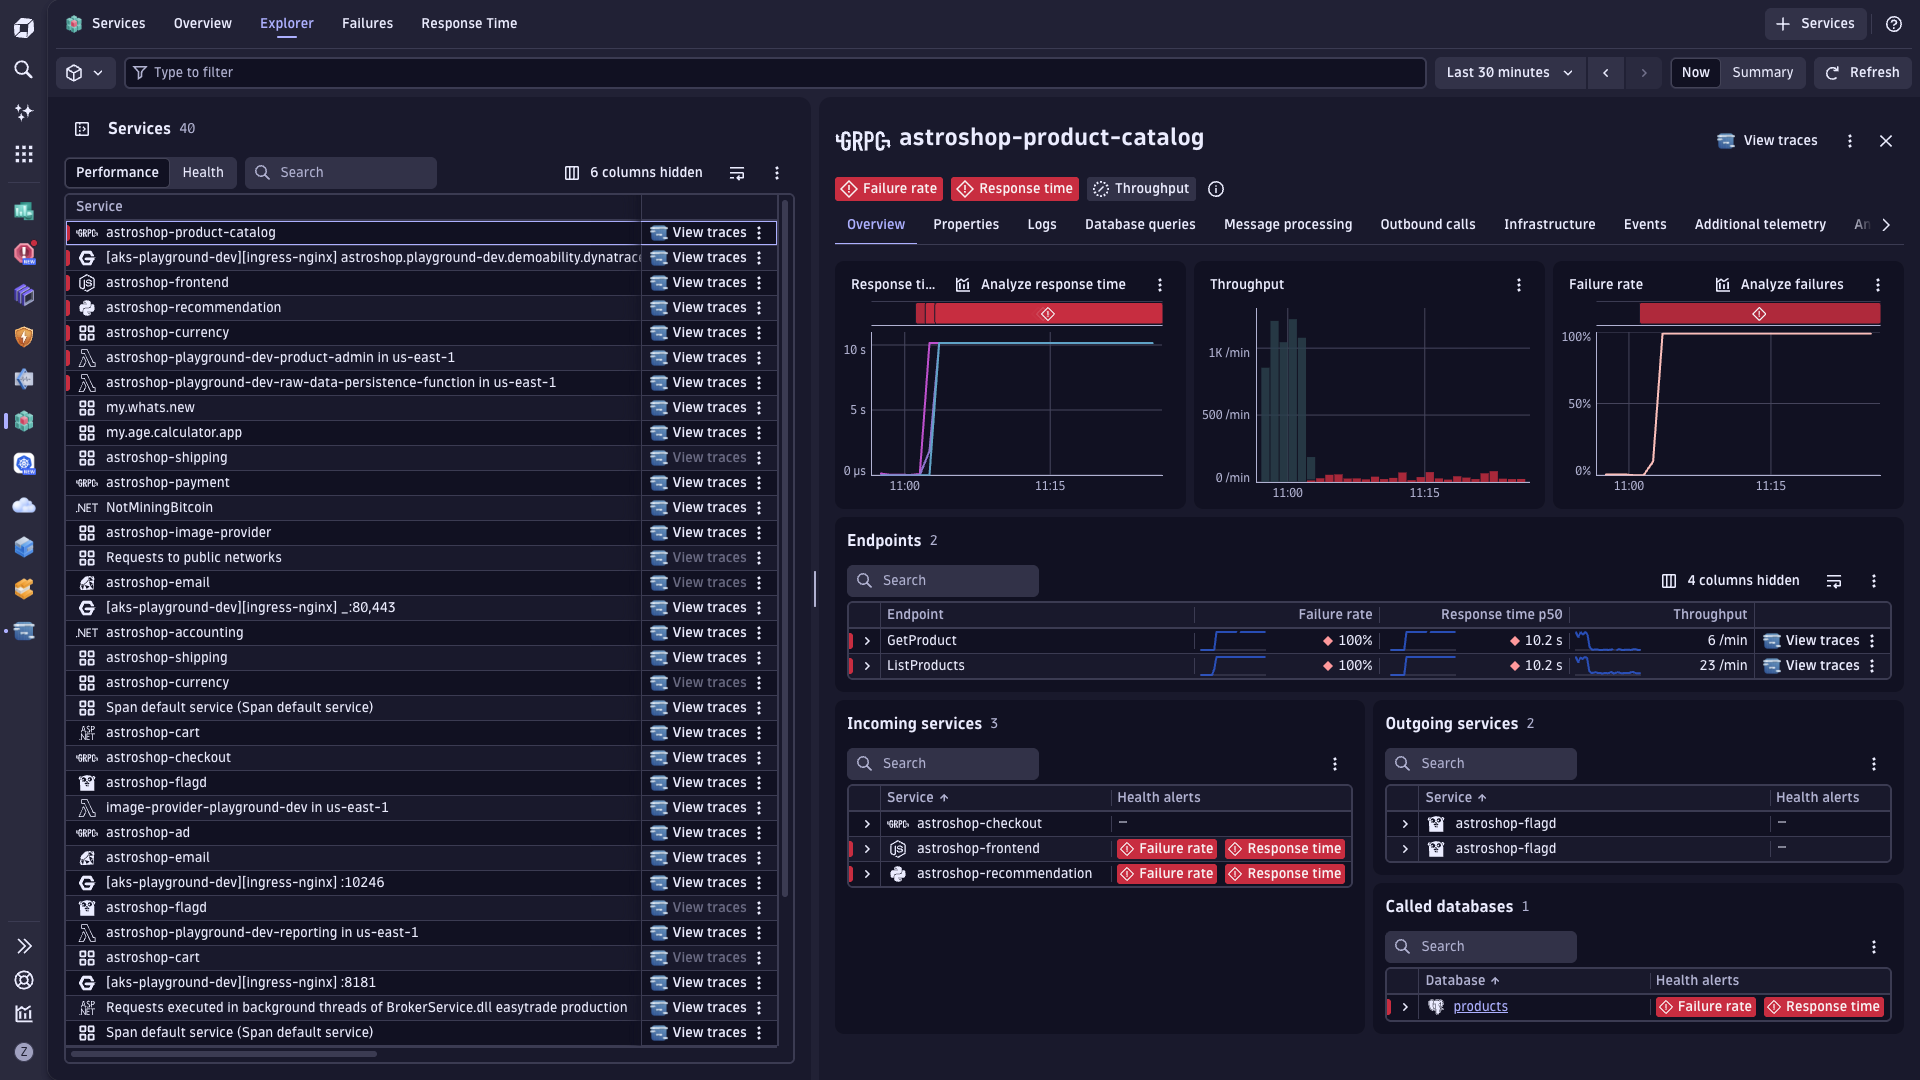
Automate observability for cloud native workloads and microservices
Maintain reliability and meet performance goals across fast-changing environments with:
- Real-time topology discovery of services, dependencies, and workload changes
- Intelligent baselines for latency and error rates in serverless, containerized, and Kubernetes deployments
- Health and availability tracking enriched with OpenTelemetry data
- Early detection of risks in application components and supporting services
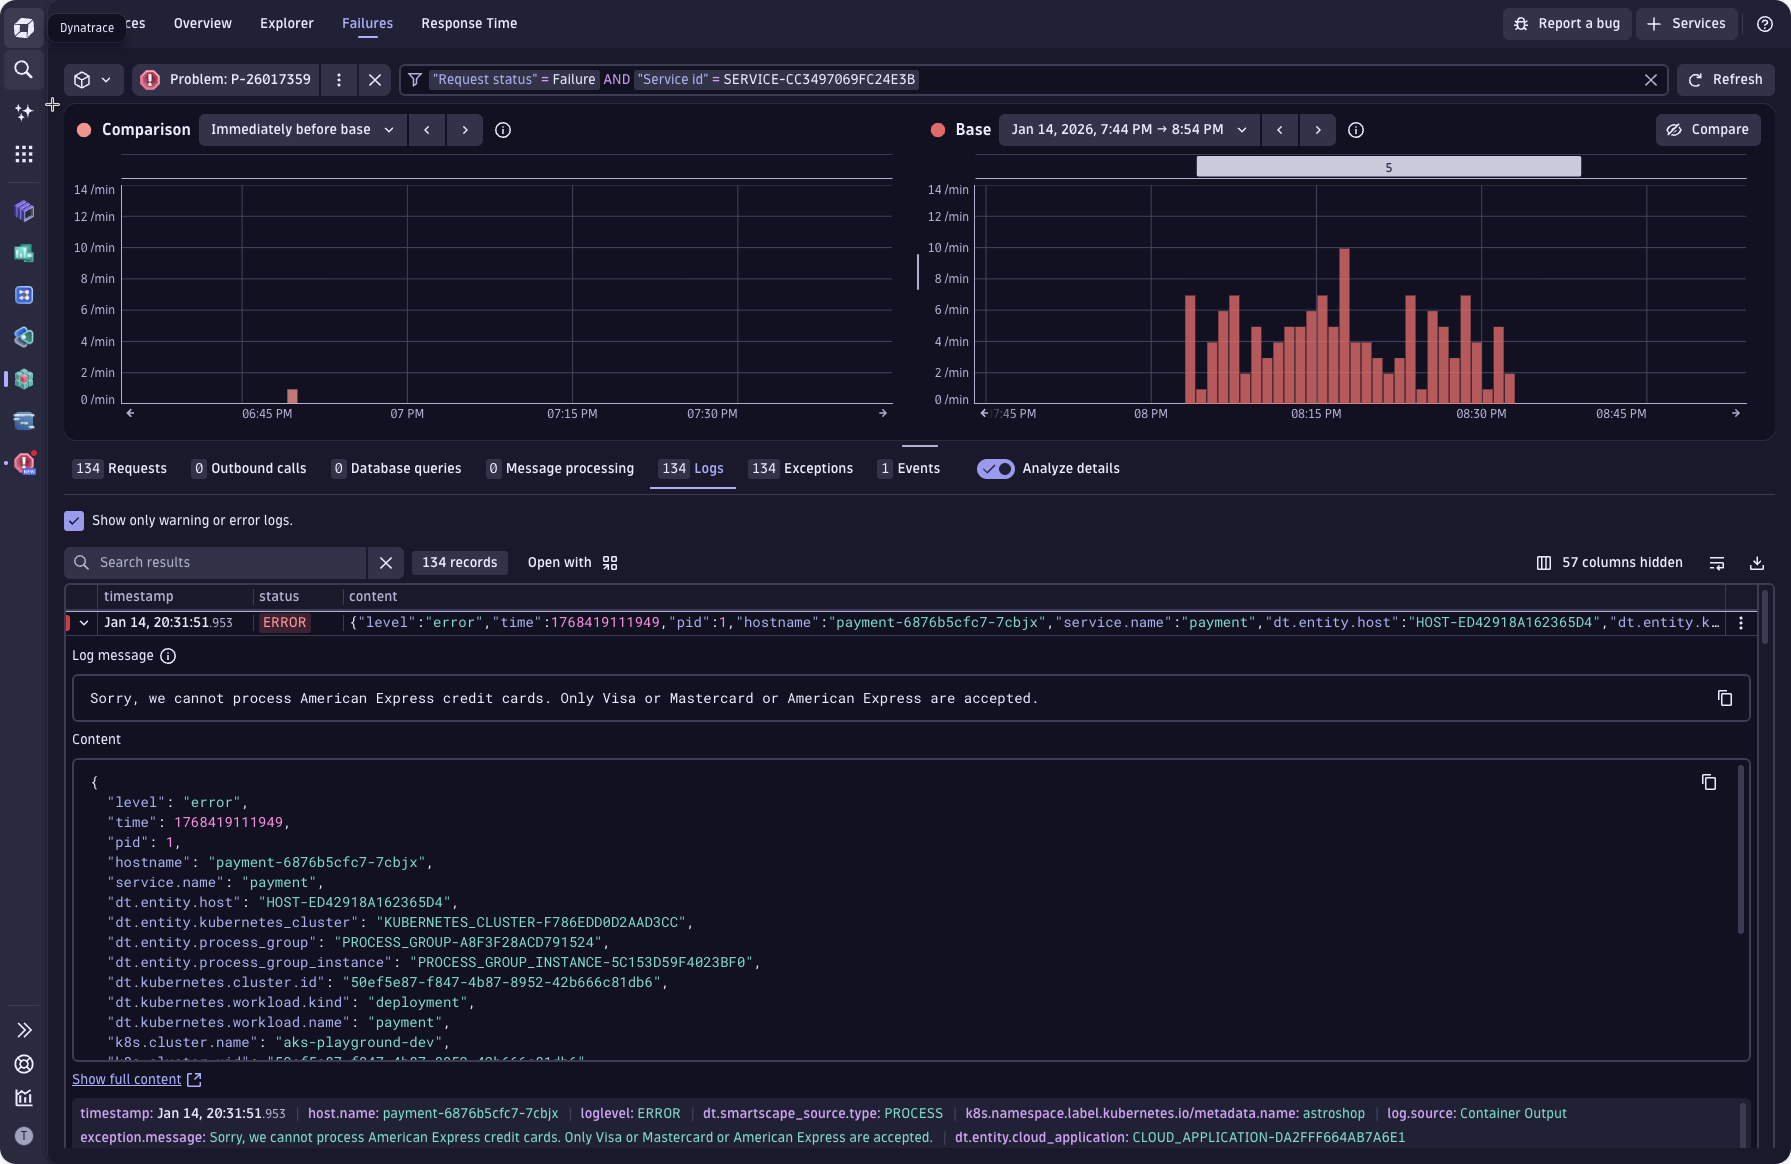
Improve team collaboration and eliminate war rooms
Break down silos with real time application insights and end to end performance analytics through:
- AI-powered root cause and impact analysis across traces, logs, metrics, and events
- Version and deployment analytics to track changes across your environment
- Interactive exploratory analytics with advanced querying across massive data volumes
- Complete contextual view combining telemetry from all sources for end-to-end observabilit
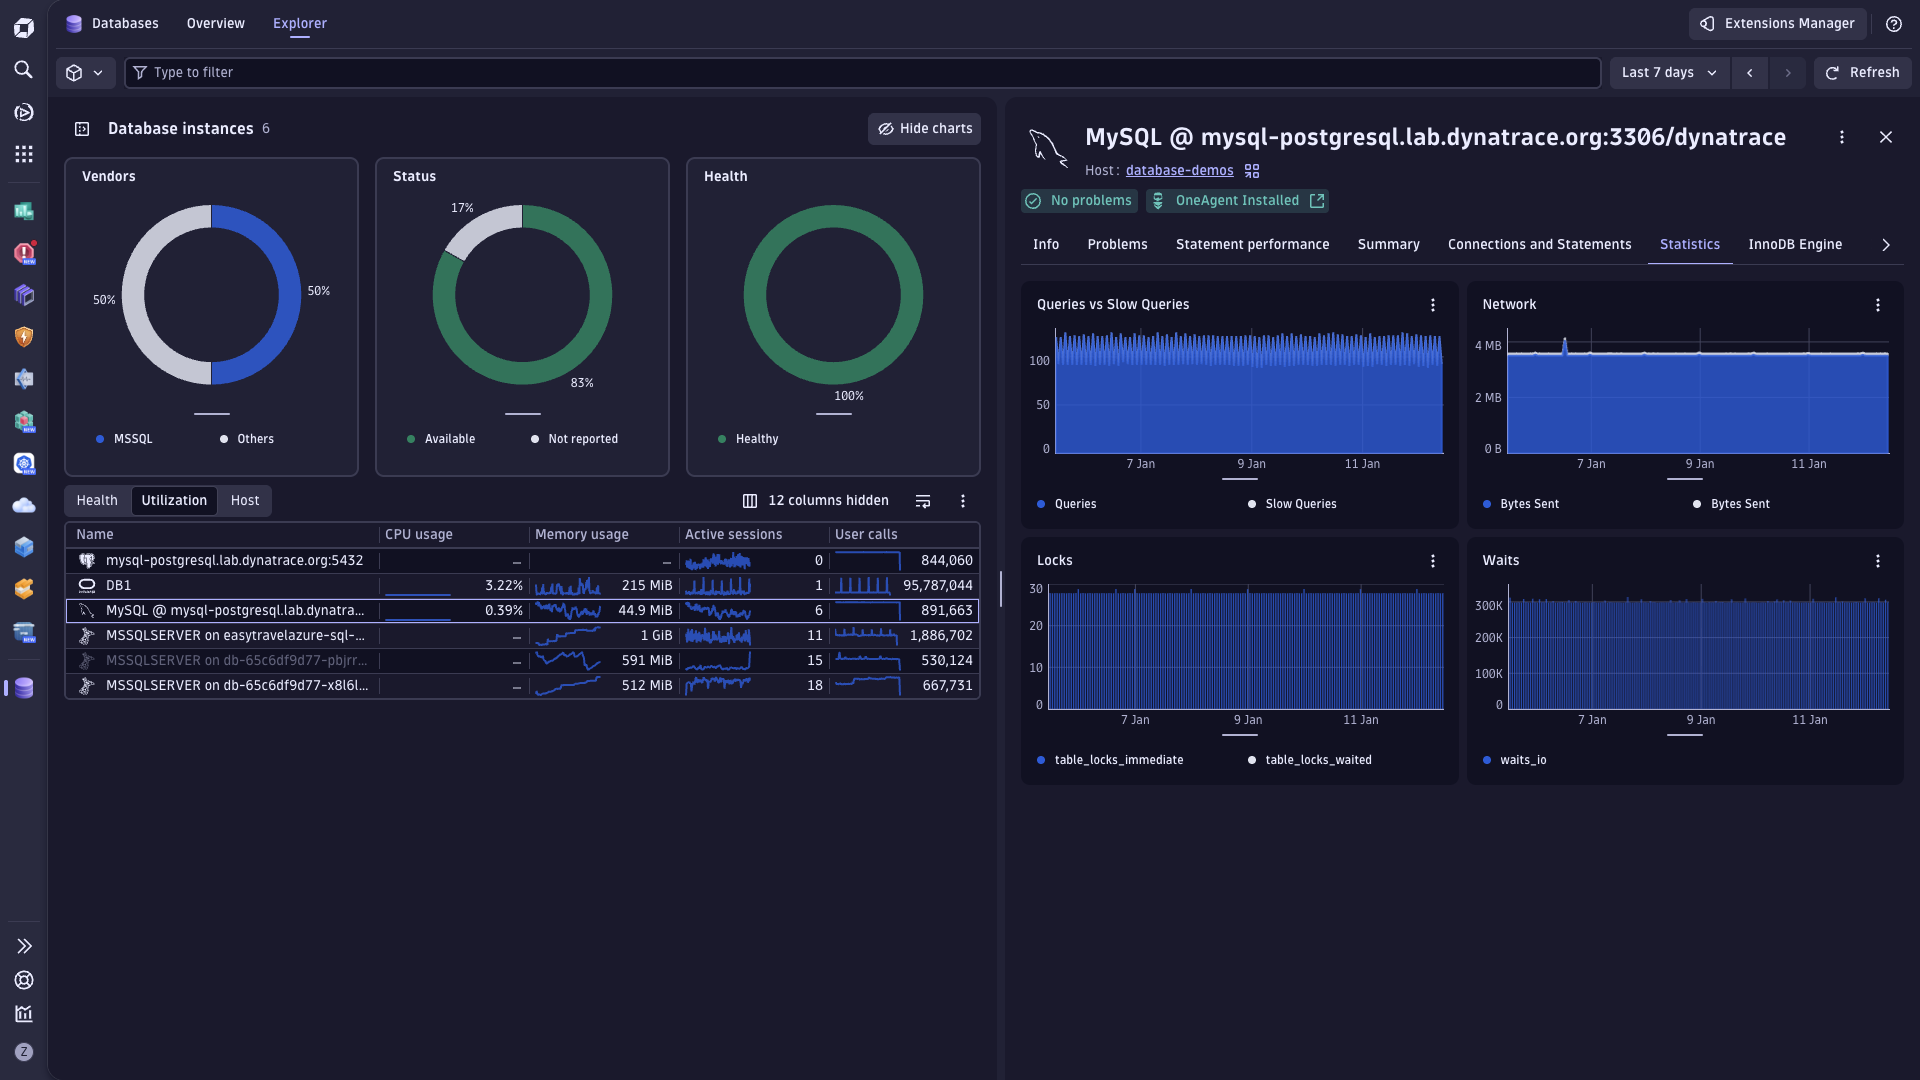
Optimize database performance and application dependencies
Resolve database bottlenecks faster with full visibility into queries, health, and service relationships:
- Health metrics and performance insights for every database instance
- SQL statement execution analysis to identify slow queries
- End-to-end dependency mapping from services to databases
Improve developer productivity
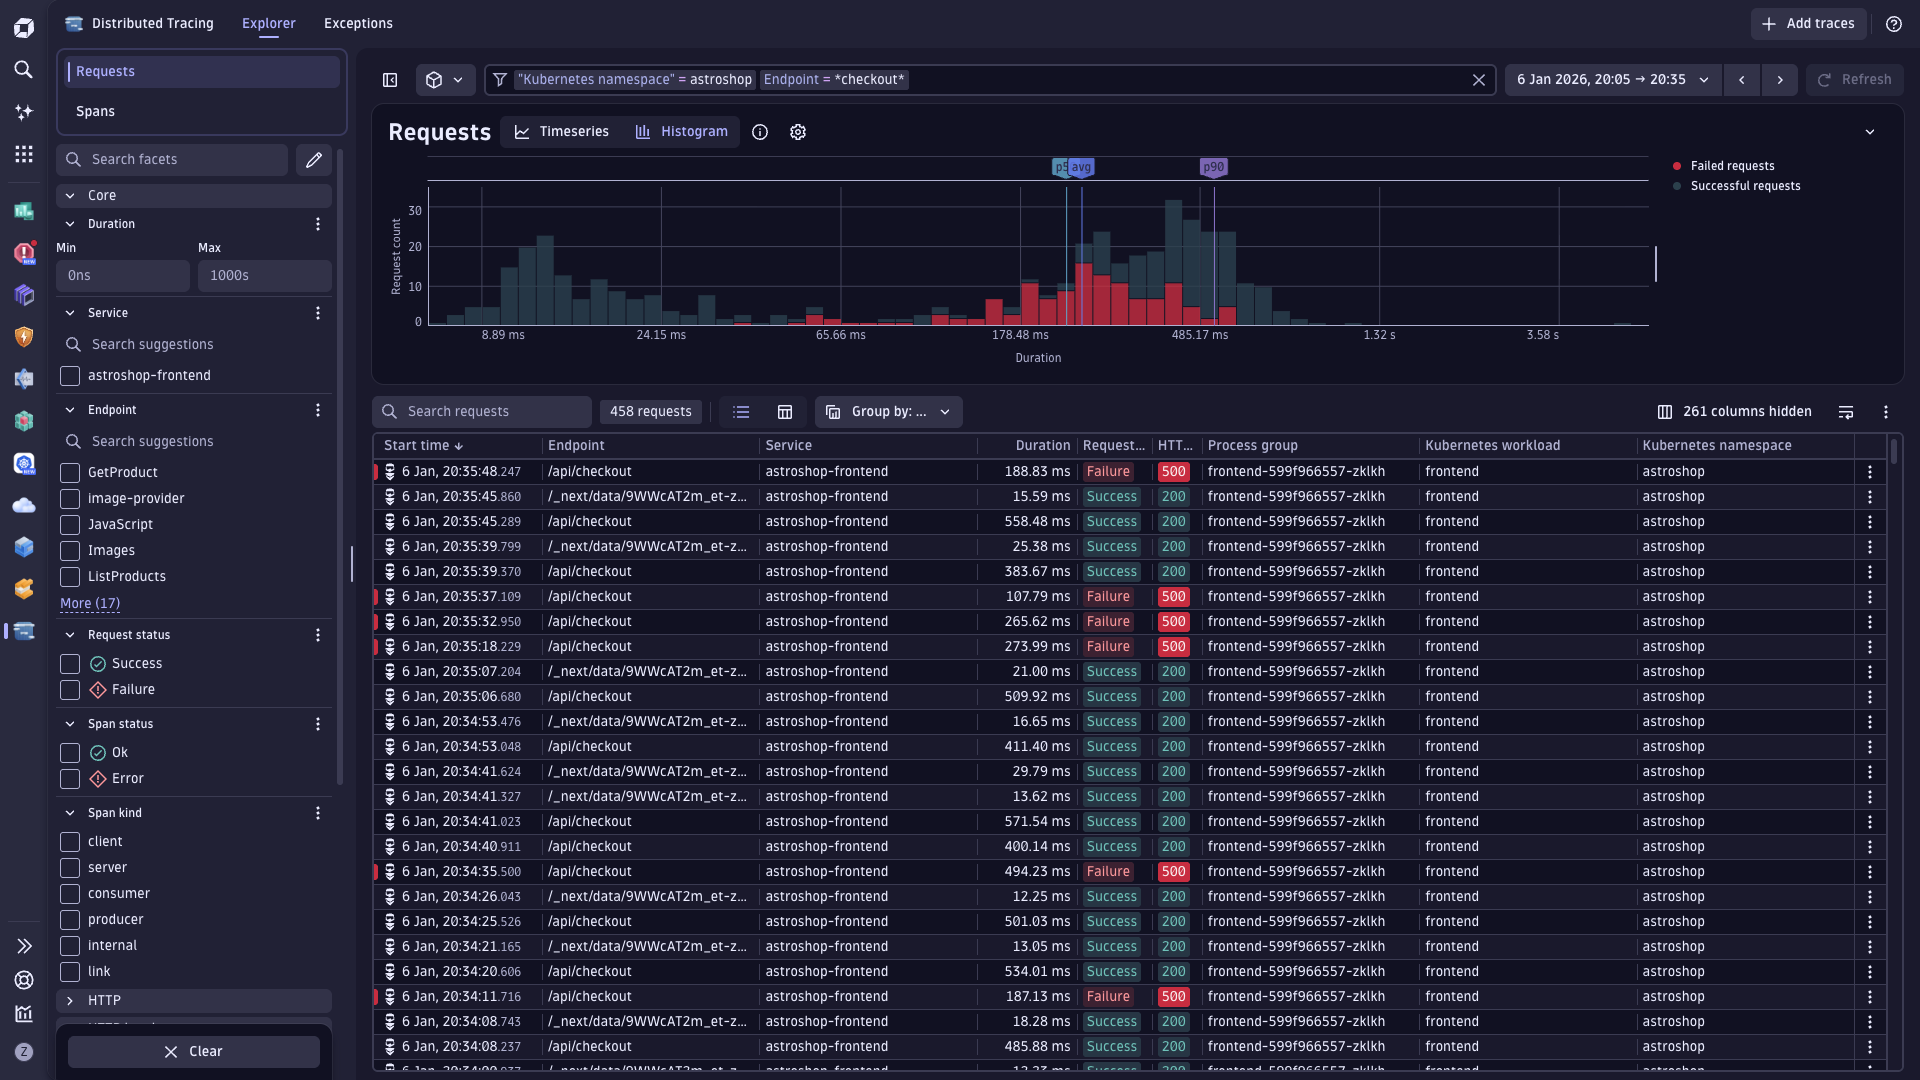
Identify the source of problems with seamless signal integration
Understand details in context across a unified dataset with:
- Enterprise-scale end to end tracing
- Powerful response time and error analysis
- Logs in the context of traces
- OpenTelemetry analytics powered by Grail
Optimize application efficiency with code level insights
Reduce end user latency, sync, and locking issues with:
- Continuous production profiling with thread, CPU, and memory allocation analysis
- Deep code-level visibility down to individual methods for CPU usage and I/O bottlenecks
- Memory insights to identify leaks, excessive allocations, and performance slowdowns
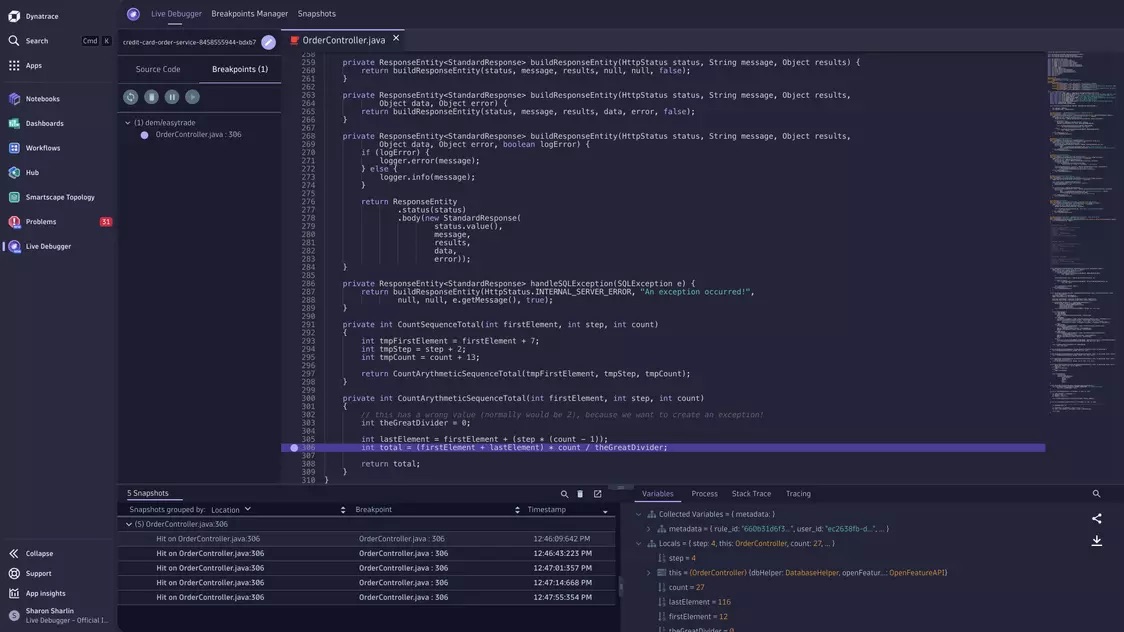
- Real-time debugging data from production or any remote environment